Autism Chart Guide: Spectrum Levels, Traits, and Supports
June 11, 2026 | By Eliza Finch
An autism chart can make a complicated topic easier to scan, but it can also oversimplify autistic experience if it is treated like a final answer. Some charts show support levels, some show common traits, some show prevalence by year, and others help families or professionals notice communication patterns or daily triggers. If you are using a chart while exploring your own traits, pair it with context, reflection, and, when needed, professional input. A private autism self-reflection starting point such as a supportive AQ exploration tool can help organize questions without turning a chart into a label.

What an Autism Chart Can and Cannot Show
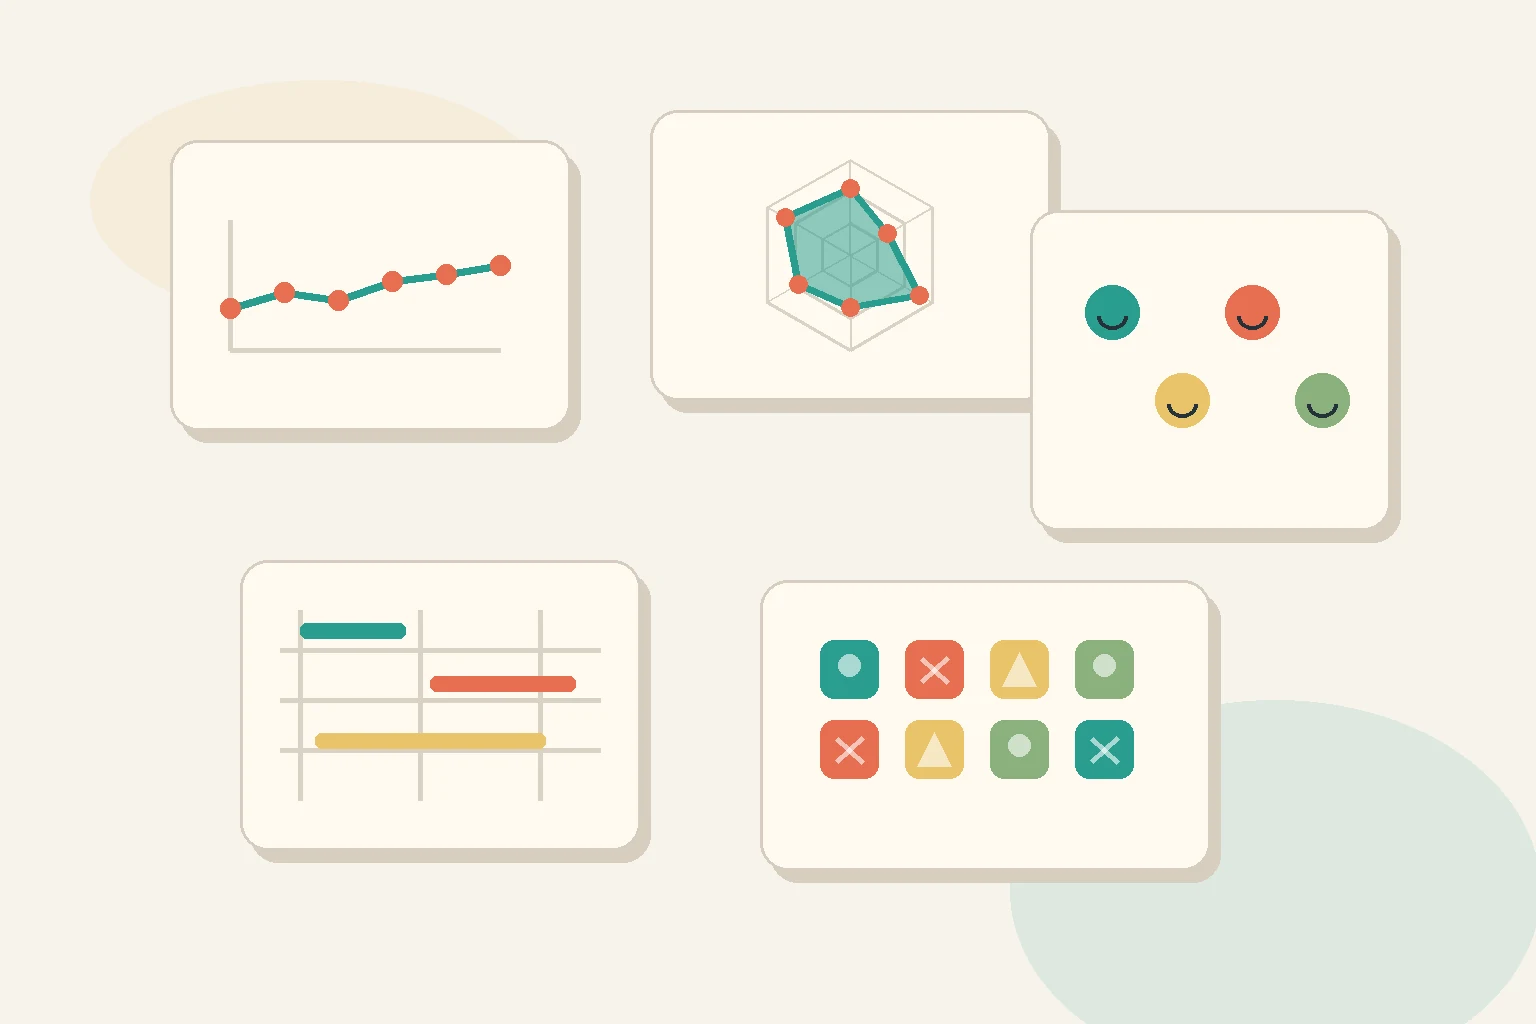
The phrase "autism chart" does not point to one standard visual. It can mean a chart of autism traits, an autism levels chart, a prevalence graph, an emotion chart, an ABC behavior chart, an AQ score chart, or a comparison such as ADHD vs autism. Each format answers a different question.
A good chart can help you notice patterns. It can make abstract ideas more concrete, especially when you are comparing social communication, sensory differences, routines, interests, executive functioning, and support needs. It can also help you prepare better notes for a school meeting, therapy appointment, workplace accommodation discussion, or personal reflection session.
What a chart cannot do is determine who someone is, explain every situation, or replace a comprehensive clinical evaluation. Autism is a neurodevelopmental difference that involves patterns across communication, social interaction, restricted or repetitive behaviors, sensory experience, daily functioning, and strengths. A chart is useful only when its purpose is clear.
Use this quick rule: if the chart helps you ask better questions, it is probably useful. If it invites you to rank people as "more" or "less" autistic in a simple way, it is probably too narrow.
The Spectrum Is Not a Straight Line
Many people picture the autism spectrum as a line from mild to severe. That image is easy to understand, but it is not very accurate. A more helpful autism spectrum chart looks like a profile, not a ladder.
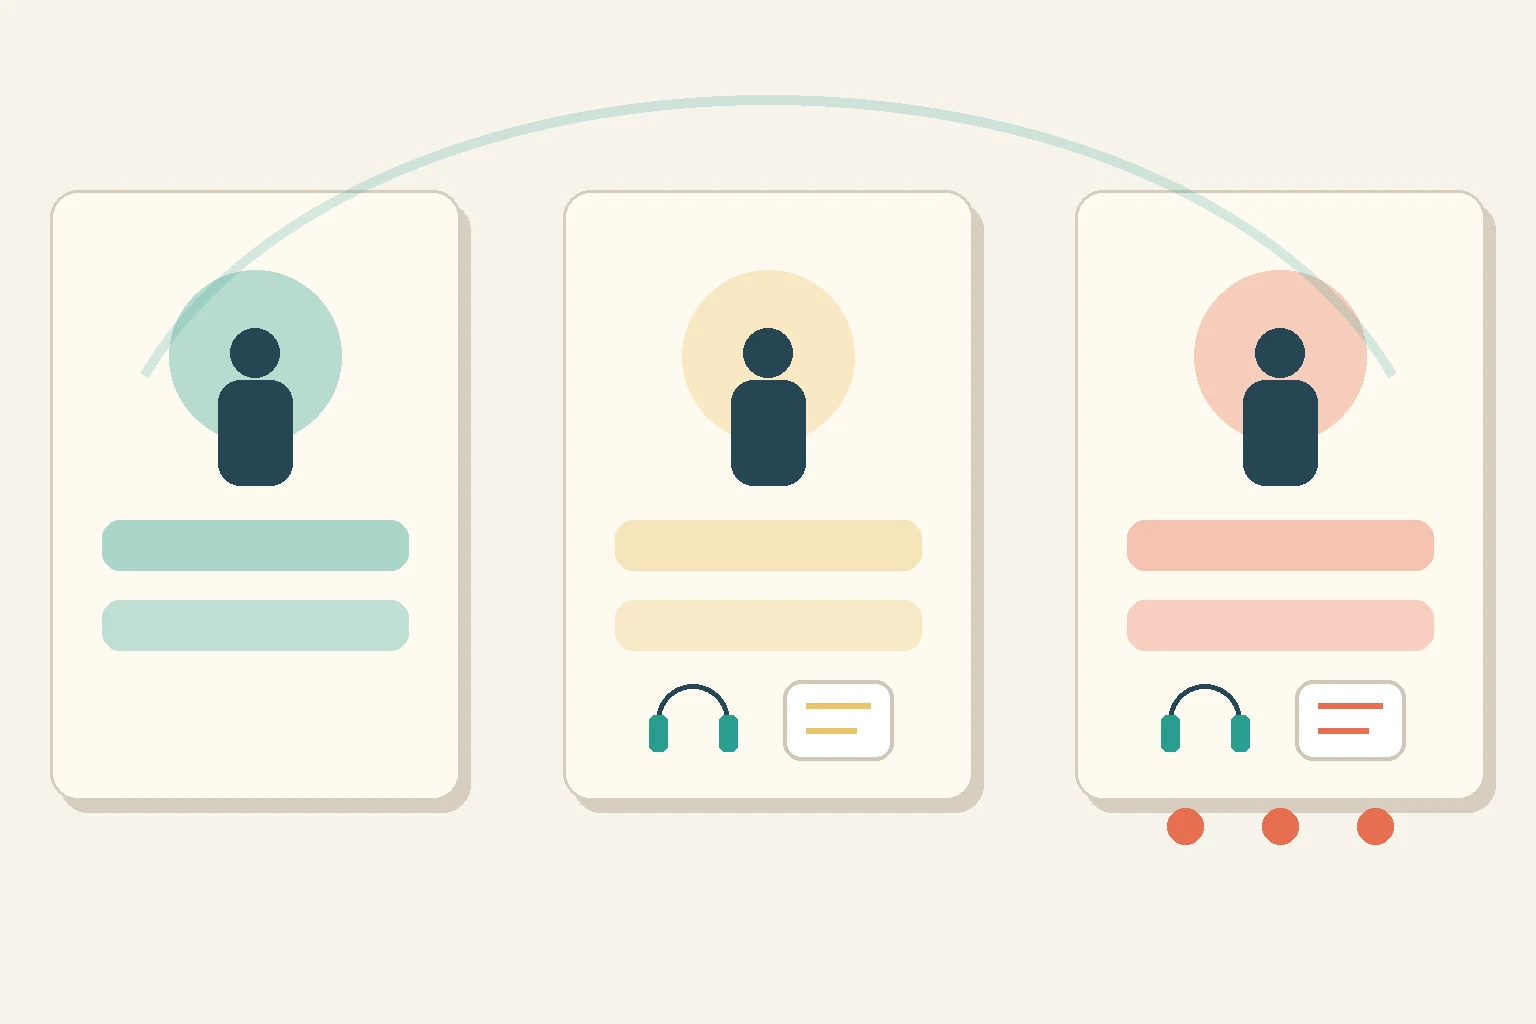
One autistic person may have strong spoken language, intense sensory sensitivity, major transition stress, and deep expertise in a focused interest. Another may communicate mostly through AAC, have lower sensory reactivity, seek constant movement, and need substantial daily support. A third may appear socially fluent at work but spend enormous energy masking, recovering, and managing burnout.
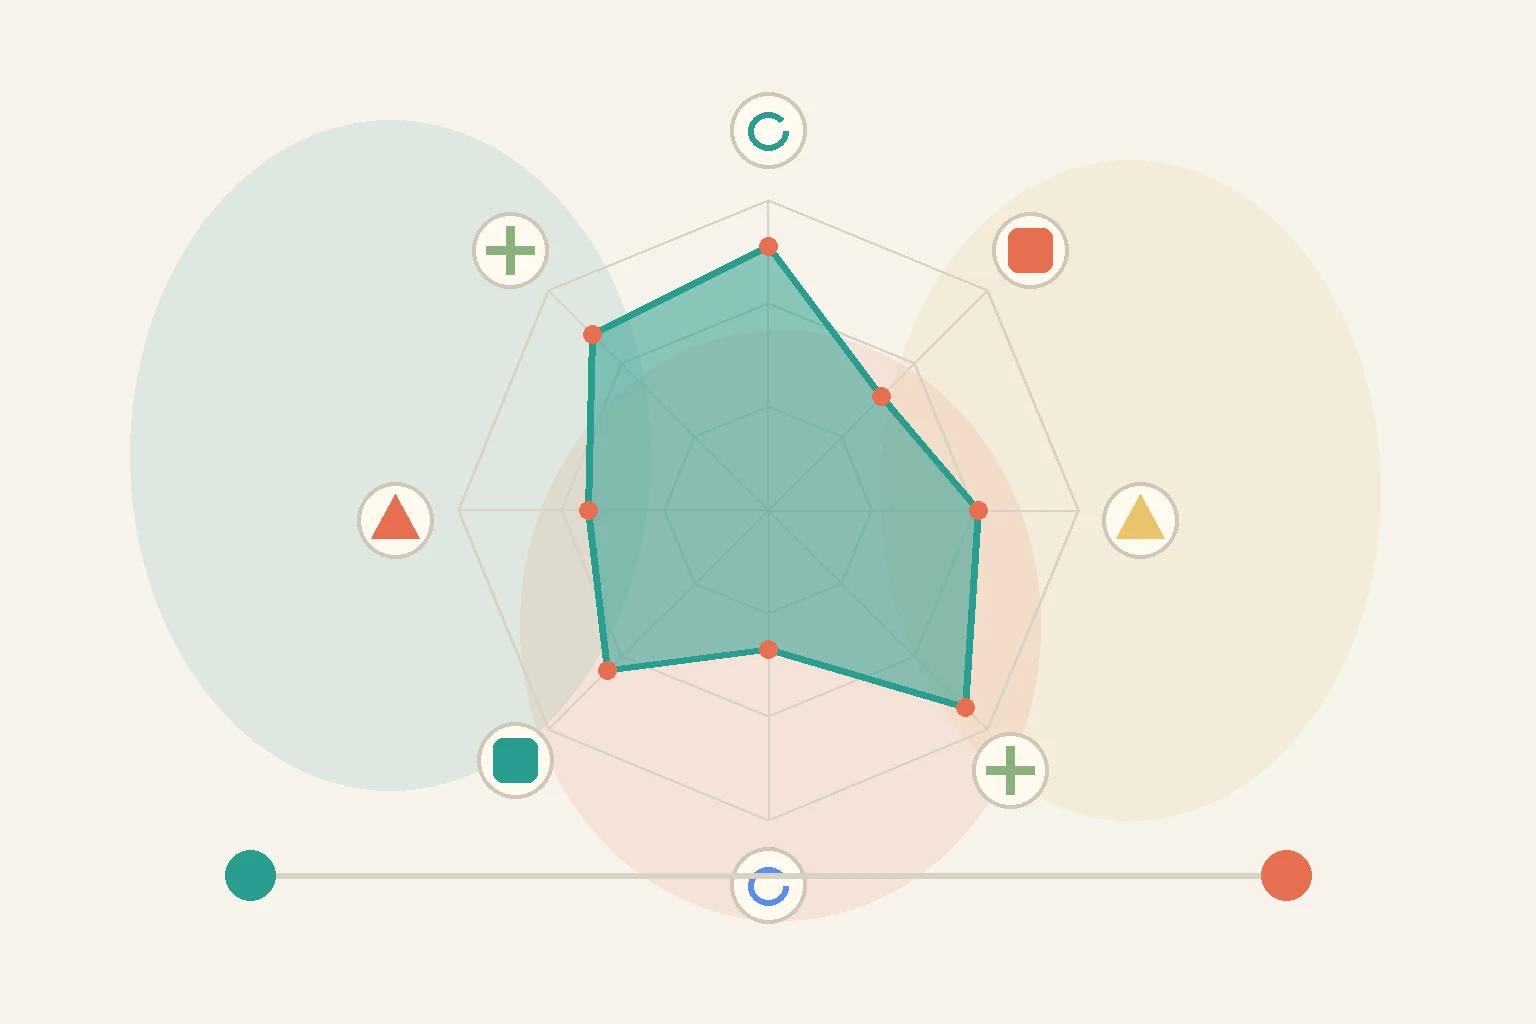
Those differences are why circle charts, radar charts, and trait maps often explain autism better than one-number scales. They can show that traits vary by area, context, stress level, age, environment, and available support. They also leave room for strengths, such as pattern recognition, deep memory, honesty, visual thinking, sustained focus, or creative problem solving.
When you see a chart of autism, ask whether it shows multiple dimensions. The most useful visuals usually include both challenges and strengths, and they avoid implying that every autistic person follows the same path.
Autism Levels Chart Means Support Needs, Not Personal Worth
Many searches for "autism level chart" or "autism levels chart" are really asking about the three ASD support levels used in DSM-5 language. These levels describe how much support a person may need in two broad areas: social communication and restricted or repetitive behaviors. They are not a measure of intelligence, kindness, potential, personality, or value.
| Level | Common wording | What the chart is trying to show |
|---|---|---|
| Level 1 | Requiring support | A person may speak fluently but still need support with social communication, flexibility, planning, transitions, or daily demands. |
| Level 2 | Requiring substantial support | Differences are more apparent across settings, and the person may need more consistent help with communication, change, routines, or regulation. |
| Level 3 | Requiring very substantial support | The person may need intensive support for communication, flexibility, daily functioning, safety, or participation across many settings. |
This kind of levels of autism chart can be useful when discussing service needs. It becomes less useful when people treat it as a fixed identity category. Support needs can change with environment, stress, health, communication access, trauma, burnout, accommodations, and life stage.
Level 1 autism is often misunderstood because a person may look "fine" from the outside while working very hard internally. Someone can have strong vocabulary, a job, or good grades and still need meaningful support with sensory overload, social interpretation, planning, transitions, or recovery time. For personal reflection, AQ-based trait exploration can help you look at patterns across domains before deciding what to discuss with a qualified professional.
Common Autism Chart Types and When to Use Them
Different chart types serve different readers. Before trusting a visual, identify what job it is supposed to do.
| Chart type | Best use | Main limitation |
|---|---|---|
| Autism spectrum chart | Showing that traits vary across multiple dimensions | Can become misleading if it ranks people on one simple line |
| Autism levels chart | Explaining broad support needs | Does not capture every strength, context, or daily fluctuation |
| Autism chart by year | Showing prevalence estimates or reporting trends over time | Changes may reflect screening, awareness, access, definitions, and data sources |
| Autism score chart | Interpreting a screening or self-assessment score | Scores are not the same as a formal ASD assessment |
| Communication chart | Matching support strategies to communication needs | Should be personalized with the person's preferences |
| Emotion or feelings chart | Helping identify and communicate internal states | Some people may need body cues, sensory words, or AAC instead of face-based labels |
| ABC behavior chart | Recording antecedent, behavior, and consequence patterns | Works best when observations are neutral and collected over time |
An autism chart by year is especially easy to misread. For example, U.S. public health charts may show higher reported prevalence in more recent surveillance years. That does not automatically mean autism itself has changed at the same rate. Differences in screening access, service systems, definitions, record review, public awareness, and community identification can all affect the numbers.
An ABC chart is different. It is not about prevalence or identity. It records what happened before a behavior, what the behavior looked like, and what happened afterward. The best ABC notes are specific and nonjudgmental: time, setting, sensory factors, demands, communication attempts, people present, and the immediate outcome. Over one to two weeks, patterns may become easier to see.
How to Read an Autism Chart Without Over-Reading It
Use this checklist when you see an autism scale chart, score chart, or spectrum visual:
- Check the source. Is it from a public health agency, clinical framework, research paper, advocacy resource, school handout, or personal blog?
- Check the purpose. Is it explaining support levels, traits, rates, communication, emotions, milestones, or behavior patterns?
- Check the population. Does it apply to children, adults, caregivers, educators, clinicians, a U.S. sample, or a broader group?
- Check the scale. Are higher numbers showing more support needs, more frequent traits, higher prevalence, or something else?
- Check the time frame. Is the chart describing one moment, a year, a screening result, or a pattern over weeks?
- Check the language. Does it respect autistic people, or does it frame differences only as problems?
- Check the limits. Does it clearly say what the chart cannot show?
This matters because charts feel objective. A clean visual can make uncertain information look more certain than it really is. If a chart shows "signs," remember that autistic people do not all share the same signs. If it compares autism vs ADHD, remember that the two can overlap. If it shows a score, remember that scores can be affected by masking, self-awareness, question wording, culture, age, language, and current stress.
A useful chart should make room for nuance. It should encourage reflection, better observation, and better questions rather than quick conclusions.
A Simple Autism Chart Template for Personal Notes
If you want a practical chart, build one around patterns instead of labels. The goal is to understand what supports daily life, communication, comfort, and participation.
| Area | What I notice | Helpful support | Questions to ask |
|---|---|---|---|
| Social communication | Conversation, eye contact, tone, group settings, directness, misunderstanding | Written details, extra processing time, clear expectations | When does communication feel easiest or hardest? |
| Sensory experience | Sound, light, touch, smell, food texture, movement, pain, temperature | Headphones, breaks, lighting changes, clothing choices | Which sensory inputs drain or calm me? |
| Routine and change | Transitions, surprises, task switching, interruptions | Advance notice, visual plans, flexible deadlines | What makes change easier to handle? |
| Focus and interests | Deep interests, attention shifts, detail focus, motivation | Protected focus time, interest-based learning, task batching | What helps me use focus without burning out? |
| Regulation and recovery | Shutdowns, meltdowns, fatigue, masking, sleep, stress | Quiet time, low-demand periods, sensory tools, trusted support | What are early signs that I need recovery? |
You can use this template for yourself, for a child, or for a support conversation. Keep the wording neutral. Instead of "bad behavior," write what happened. Instead of "overreacted," write the observable trigger and response. Instead of "refuses transitions," write what transition was requested, how much warning was given, and what support was available.
Over time, this kind of chart can reveal practical patterns: noisy rooms may drain attention, unclear instructions may increase stress, visual schedules may reduce conflict, or direct written communication may work better than rapid verbal instructions. Those insights are often more useful than a single label.

When an Autism Chart Should Lead to a Professional Conversation
Charts are most helpful when they support a next step. Consider speaking with a qualified clinician, pediatrician, psychologist, psychiatrist, developmental specialist, speech-language professional, occupational therapist, or school support team if traits are affecting safety, learning, work, relationships, communication, eating, sleep, mental health, or daily independence.
For adults, a chart can help organize examples from childhood, school, work, relationships, sensory life, routines, and burnout. For caregivers, it can help show patterns across home, school, sleep, meals, transitions, play, and communication. For educators or supporters, it can shift the question from "How do we stop this?" to "What is this person communicating or needing?"
If you want a gentle next step, review supportive autism screening resources as one part of a broader reflection process. Keep the pressure low. A screening tool, score chart, or autism spectrum chart may help you prepare better questions, but the most respectful goal is understanding the person in context.
FAQ
Is there an autism spectrum chart?
Yes, but there is no single official chart that captures the whole autism spectrum. Helpful charts usually show multiple dimensions such as social communication, sensory differences, routines, interests, executive functioning, strengths, and support needs.
Is there an autism chart test?
Some online tools provide score charts after a questionnaire, but a chart test should be treated as educational screening or self-reflection. It can organize traits and questions, but it is not the same as a comprehensive ASD assessment by a qualified professional.
What are the 5 levels of autism?
Current DSM-5-style language commonly uses three ASD support levels, not five: Level 1 requiring support, Level 2 requiring substantial support, and Level 3 requiring very substantial support. Other five-part charts online may be informal teaching tools, not formal levels.
What are the 7 types of autism?
Many older or informal resources list several "types," such as Asperger's syndrome, autistic disorder, or PDD-NOS. In many current clinical frameworks, these are understood under the broader autism spectrum disorder category. A modern chart is usually more useful when it shows traits and support needs rather than old subtypes.
What are the 12 signs of autism?
There is no universal list of exactly 12 signs. Common signs may involve social communication differences, intense interests, repetitive movements, sensory sensitivity, strong routine needs, difficulty with transitions, unusual play patterns, or differences in conversational rhythm. Not every autistic person has every sign.
What is high-functioning autism like?
"High-functioning" is a common phrase, but many autistic people and clinicians find it too vague. It can hide real support needs in people who speak fluently, do well academically, work, or mask distress. "Level 1 autism" and "high-functioning" are not perfect synonyms.
Which billionaire has Asperger's?
Elon Musk has publicly described having Asperger's. Public figures can make neurodiversity more visible, but they should not be used as a chart for what autism is like. Autistic people vary widely in communication, support needs, strengths, challenges, and life circumstances.